Mon - Sat 7:00 am to 7:00 pm
Emergency Cleanup Waste Estimation Guide
When tornadoes flatten neighborhoods or hurricanes scatter debris across three counties, disaster teams face one critical question: where do you even begin measuring the mess? Emergency cleanup waste estimation transforms overwhelming disaster scenes into actionable recovery plans using proven calculation methods and strategic container deployment.
At Prime Dumpster, we’ve created this comprehensive emergency cleanup waste estimation guide using battle-tested systems from professional recovery teams nationwide. You’ll learn debris math that works for hurricanes, floods, wildfires, and winter storms while navigating FEMA’s compliance requirements and coordinating with federal partners for maximum reimbursement success.
Fast Facts: Emergency Cleanup Waste Estimation
Emergency response teams need disaster-specific approaches to accurately predict debris volumes and coordinate efficient cleanup operations across multiple catastrophe types.
Hurricane Cleanup: Coastal storms generate massive volumes of mixed debris including boats, waterlogged furniture, and sand-filled structures that can produce 15-20 cubic yards per damaged home. Saltwater contamination doubles disposal complexity, requiring immediate separation of electronics and appliances from structural materials.
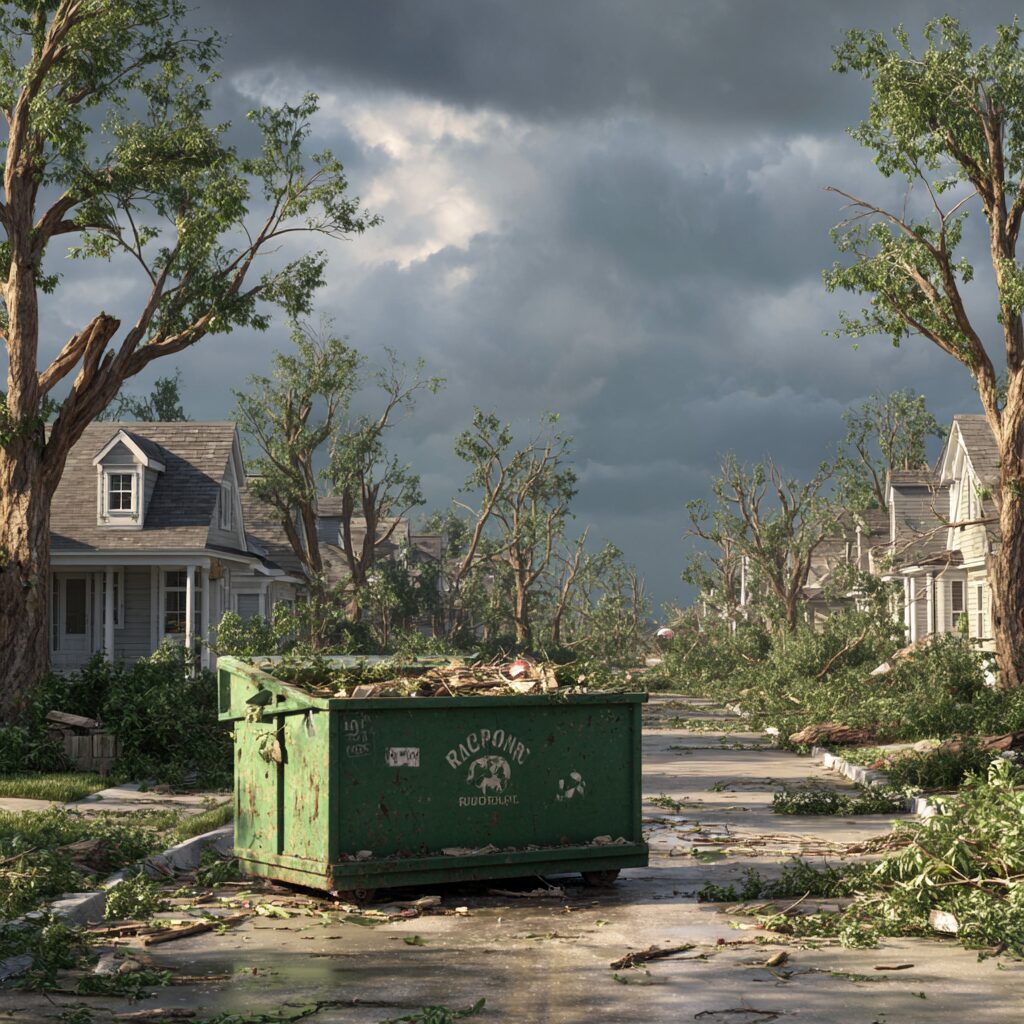
Tornado Recovery: Narrow destruction paths create concentrated debris fields mixing household items with structural materials, typically generating 25-35 cubic yards per completely destroyed home. Wind-scattered debris often lands blocks away from source properties, requiring expanded collection zones and GPS tracking for efficient removal.
Flood Aftermath: Waterlogged materials triple in weight and volume, with a single flooded basement producing 8-12 cubic yards of contaminated drywall, insulation, and household items. Rapid mold growth requires immediate removal within 48-72 hours to prevent contamination spread throughout affected structures.
Winter Storm Debris: Ice-coated tree limbs and frozen materials create handling challenges, with each acre of damaged trees producing 15-25 cubic yards of vegetation debris. Frozen conditions preserve materials temporarily but complicate equipment operation and require specialized removal techniques.
Wildfire Cleanup: Residential fire zones generate ash deposits, burned structures, and contaminated soil requiring specialized handling, with completely destroyed homes producing 100-150 tons of mixed hazardous debris. Toxic ash contamination extends beyond visible burn areas, often requiring soil removal to depths of 6-12 inches around foundation perimeters.
Now let’s explore the detailed strategies that help emergency teams master waste estimation across all disaster recovery scenarios.
Overview of Natural Disaster Waste Estimation Approaches
Imagine a hurricane’s aftermath: streets buried under trees and rooftops. Each catastrophe leaves distinct fingerprints in its debris. Your approach must adapt faster than Midwestern weather.
Disaster Type Dictates Debris DNA
Tornadoes carve narrow paths of destruction with refrigerator-sized tree trunks tangled in concrete slabs. Floods? They leave waterlogged drywall that doubles in weight. Consider these critical differences:
- Coastal hurricanes mix shredded palm fronds with shattered docks
- Midwest ice storms snap oak limbs onto frozen power lines
- Urban floods drown appliances in chemical soup
Severity Changes the Math
A Category 1 storm might down branches. Category 4? That’s entire neighborhoods stripped to foundations. Three factors reshape your calculations:
- Population density – More people means more possessions in the wreckage
- Building materials – Brick homes crumble differently than wood frames
- Local ecology – Pine forests drop needles; palm trees drop trunks
Now they adjust baseline numbers by zip code.
Innovative Emergency Cleanup Waste Estimation Techniques
When disaster strikes, the math changes. Pros now use forensic-level precision to assess damage zones – think of it as CSI: Debris Unit. Two game-changing methods have rewritten the rulebook for recovery teams nationwide.
Crunching Numbers: Area vs. Structure
Ever tried guessing jellybeans in a jar? Disaster pros face similar challenges. The EPA’s I-WASTE tool offers two approaches:
- Per-acre math shines in hurricane zones where damage varies block by block
- Structure formulas excel in tornado alleys where one home stands while its neighbor’s gone
Texas crews used acre-based calculations after Hurricane Harvey, mapping debris density across 300 square miles. Midwest teams prefer structure counts when tracking EF-3 tornado paths through suburbs.
Material Matters: Sorting the Chaos
Debris comes in flavors – each needing special handling. Japan’s time-trend analysis proves categorization saves weeks of work:
- Vegetation: Summer leaves vs. winter timber weight changes disposal plans
- Structural: Brick rubble needs different gear than shattered drywall
- Mixed: Requires sorting teams – the ultimate recycling challenge
Seattle’s 2022 windstorm response proved this right. Crews separated Douglas fir logs from roofing materials upfront, cutting disposal costs by 37%.
Smart teams combine EPA tools with local knowledge. Know your region’s building materials? That concrete percentage in your mental Rolodex? That’s gold when the clock’s ticking.
Managing Waste from Specific Natural Disasters
Different disasters create different headaches. What works for a Florida hurricane fails miserably in Minnesota blizzards. Let’s break down the messy realities of five major events.
Hurricanes, Tornadoes, and Flood-Related Damage
Category 4 winds turn patio umbrellas into missiles and palm trees into battering rams. Coastal teams juggle three debris types at once: splintered docks, drowned appliances, and enough sand to bury a pickup truck.
Prime Dumpster Pro Tip: Separate boats from broken drywall early – saltwater-soaked materials rot faster than bananas in a heatwave.
Twisters leave neighborhoods looking like Godzilla’s confetti party. Their narrow paths mix shredded insulation with mangled cars, demanding puncture-proof gloves and eagle-eyed sorting crews.
Midwest responders keep chemical spill kits handy when tackling tornado debris – you never know what’s in that crushed garage.
| Disaster Type | Debris Profile | Must-Have Gear |
| Hurricane | Boats, wet furniture, uprooted trees | Heavy machinery, moisture meters |
| Tornado | Mixed hazardous materials, metal shards | Cut-resistant gloves, debris screens |
| Flood | Waterlogged drywall, contaminated mud | Hazmat suits, dehumidifiers |
| Winter Storm | Frozen tree limbs, collapsed roofs | Chainsaws, ice melt spreaders |
| Wildfire | Ash deposits, burned structures, contaminated vegetation | Respirators, soil testing kits, ash removal equipment |
Addressing Winter Storms
Ice storms turn oak branches into crystal chandeliers… that shatter onto power lines. Northern crews prep for double duty: clearing frozen timber while watching for hidden roof damage under snowdrifts. Those picturesque icicles? They’re gutters waiting to collapse.
Wildfire Related Damage
Wildfire debris in residential areas creates a toxic mixture of ash deposits, burned structural materials, and contaminated soil that requires specialized handling protocols. Homeowners face charred lumber, melted appliances, compromised foundations, and hazardous ash containing heavy metals and chemicals from synthetic materials that burned during the fire.

Selecting the Right Rolloff Dumpster Sizes for Effective Cleanup
Choosing the right container size turns chaos into order. Get it right, and debris removal becomes clockwork.
Dumpster Size Capacity Guidelines
| Size | Capacity | Best For | Real-World Example | |
| 10-yard | 3-4 tons | Minor roof repairs | Small yard projects | 1 flooded basement |
| 15-yard | 4-6 tons | Kitchen remodels | Moderate storm damage | 3 pickup truck loads |
| 20-yard | 6-8 tons | Whole-house cleanouts | Major wind events | 10 fallen trees |
| 30-yard | 8-10 tons | Multi-room renovations | Small business recovery | 15 appliances + drywall |
| 40-yard | 10-12 tons | Commercial properties | Neighborhood hubs | 50 roofing squares |
Why Rolloffs Rule
These mobile monsters solve three critical problems when the unthinkable happens:
- Speed: No more 47 trips to the landfill – load once, haul once
- Safety: Contained materials reduce tripping hazards and airborne particles
- Compliance: Separate containers meet strict recycling rules for electronics and hazardous materials
Remember: Mixing concrete chunks with soggy couches creates disposal headaches. Smart teams use color-coded bins – blue for metals, green for vegetation, red for hazardous items. It’s like adult LEGO sorting, but with bulldozers.
Aligning Cleanup Strategies with FEMA Guidelines and Federal Processes
Federal paperwork might not spark adrenaline, but it fuels recovery engines. Getting cozy with FEMA’s playbook separates thriving communities from those stuck in reimbursement limbo. Let’s crack the code on turning bureaucratic hurdles into recovery rocket fuel.
Navigating FEMA Guidelines and the Disaster Declaration Process
FEMA’s Public Assistance program works like a financial GPS – but only if you enter coordinates correctly. Miss one form? That’s money left on the table. Kentucky’s 2023 flood teams learned this fast: Their pre-stamped inspection checklists cut approval times by half.
Disaster declarations unlock federal cash, but the clock starts ticking the moment winds die down. You’ve got seven days to document damage like a forensic accountant. Pro tip: Snap geo-tagged photos of every pile – FEMA loves metadata almost as much as coffee.
Procurement rules trip up even seasoned pros. Yes, you need three bids for tree removal during a crisis. No, handshake deals won’t fly. Chicago’s 2022 derecho response nailed this by pre-approving contractors through their emergency management system.
- Color-code paperwork: Green folders for vegetation logs, red for hazardous materials
- Train staff on FEMA’s mobile app before storm season
- Partner with neighboring governments to share compliance officers
Environmental regulations don’t pause for disasters. That collapsed factory? Its asbestos needs special handling, crisis or not. Oregon’s wildfire teams use FEMA’s guidance documents as bedtime reading – boring but brilliant for avoiding fines.
Collaborating with Local, State, and Federal Emergency Management Agencies
Now in our emergency cleanup waste estimation guide, let’s explore the relationship between your team and other agencies. Success hinges on one truth: Local leaders steer the ship, but they need crewmates. Japan’s regional cooperation councils cracked this code – their pre-storm agreements let neighbors share bulldozers like borrowed sugar.
Coordinating Efforts with Emergency Management Teams
Unified command structures prevent turf wars. Think of it as a three-layer cake:
- Local governments direct ground operations (they know every pothole and power line)
- State teams roll in with specialized gear – like mobile crushers for concrete mountains
- Federal partners handle big-money logistics but require paperwork thicker than hurricane shutters
Kentucky’s flood response proved this works. Local crews flagged debris hotspots while state helicopters mapped access routes. Federal funds flowed faster because everyone used the same damage assessment app.
Integrating Public Assistance and Community Support Initiatives
Volunteers wielding chainsaws need structure. Smart systems turn chaos into progress:
- Color-coded zones for resident helpers (green areas = safe vegetation removal)
- Pre-trained neighborhood captains to coordinate sorting teams
- Shared dashboards showing real-time dumpster capacities across counties
Remember: Homeowners want to help but don’t know hazardous materials from Halloween decorations. Oregon’s wildfire recovery used QR code tags on debris piles – scan to get disposal instructions. Genius meets practical.
Resourceful Approaches and Tools for Effective Debris Management
One important element of our emergency cleanup waste estimation guide is exploring the gadgets needed for each scenario. Modern systems turn overwhelming piles into organized action plans. Let’s explore the tech and tactics that separate chaos from control.
Leveraging Disaster Debris Recovery Tools and Information Systems
The EPA’s Disaster Debris Recovery Tool works like a calculator for chaos. Plug in disaster types and building materials – out pop reliable volume estimates. Pair it with their Municipal Solid Waste Decision Support Tool to map recycling centers before disaster strikes. It’s like having Google Maps for garbage.
Geographic information systems (GIS) transform debris tracking into live-action strategy games. Crews update removal progress in real time, while managers spot bottlenecks faster than kids find cookie jars. Japanese researchers perfected this with their Sai-Hai training programs – think flight simulators for debris teams.
Applying Best Practices in Waste and Debris Removal
OSHA’s safety matrices aren’t just paperwork – they’re cheat codes for keeping crews unharmed. Their mold guidance and PPE charts belong in every team’s glovebox. Remember: Chainsaws and hazmat suits mix like oil and water without proper training.
Smart teams adopt three non-negotiable rules:
- Color-code debris piles like traffic lights (green for vegetation, red for hazards)
- Rotate sorting crews every two hours – fatigue causes costly mistakes
- Partner with environmental specialists before disturbing ash deposits or contaminated soil areas
These resources transform disaster zones into recovery blueprints. Your work starts long before the storm – arm yourself with these tools now.
Coordinated Disaster Recovery Solutions Nationwide
Thank you for reading our emergency cleanup waste estimation guide! Smart emergency cleanup waste estimation prevents costly delays while ensuring compliance with federal guidelines. Proper debris calculation and container sizing transform chaotic disaster zones into organized operations that restore normalcy faster when every hour counts.
Prime Dumpster facilitates nationwide dumpster rentals for multi-disaster recovery operations, with government certifications ensuring compliance with FEMA requirements and emergency response protocols.
Contact our team to learn how we can help streamline your next disaster recovery project through proven strategies and coordinated logistics support.
If you are looking for Hurricane Cleanup Waste Estimation for Gulf Coast and Atlantic Recovery Teams, Click Here
Recent Posts


Follow Us
Have any questions?
+1 844 853 3867
Give us a call today so we can help you find the right waste & sanitation solution for
your project!
Contact Us